
The previous week began on a positive note for risk sentiment, largely attributed to the absence of a ground offensive in Gaza. However, this optimism took a downturn starting from Wednesday, following Israeli Prime Minister Netanyahu's announcement that they were gearing up for a potential ground invasion.
Adding to the negative tone, the US Jobless Claims data on Thursday reported a significant deviation from expectations, particularly in Continuing Claims, hinting at a potential softening in the labor market. By Friday, risk sentiment further eroded, as many market participants preferred not to maintain long positions heading into the weekend, especially in light of early reports indicating the commencement of the invasion.
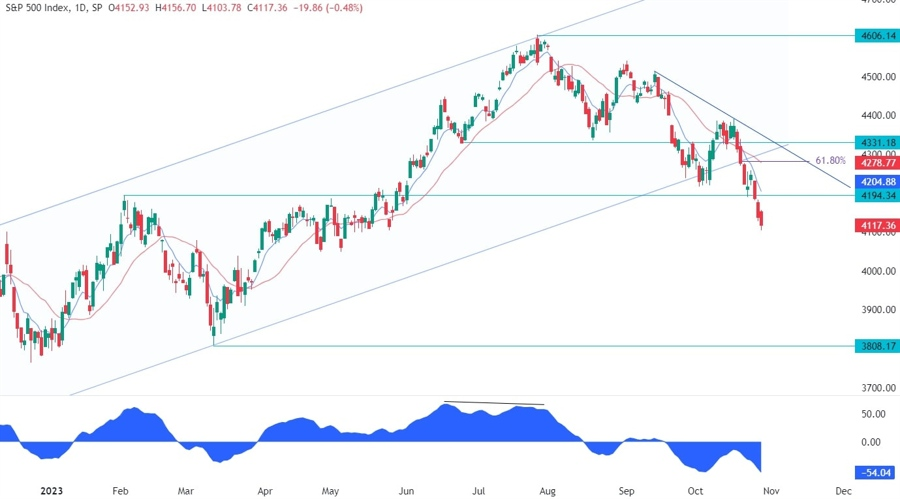
On the daily chart, the S&P 500 has been consistently setting new lows, with sellers now directing their focus towards the 3800 level. This shift in momentum occurred after the breakout of the ascending channel and a significant breach of the key support at 4194.
From a risk management standpoint, the downward movement has extended quite a bit, as evidenced by the substantial deviation from the blue 8-day moving average. In situations like this, it's common to observe a retracement back towards the moving average or a period of consolidation before the next significant price movement.
While the trendline, in combination with the 61.8% Fibonacci retracement around the 4300 level, presents an attractive area for potential sellers, it's currently challenging to envision a substantial rally occurring in the near term.

Looking at the 4-hour chart, the previous support level at 4194 has now transformed into a formidable resistance barrier. In addition to this, we can identify a noteworthy point of confluence at the 38.2% Fibonacci retracement level.
This convergence of resistance levels is likely to attract seller interest, with traders seeking to establish positions that come with clearly defined risk management parameters just above this level. Their objective would be to capitalize on a potential further decline, targeting new lows in the market.
Conversely, buyers will be keeping a watchful eye on the prospect of the price breaking above this resistance barrier. Should this occur, it could lead to an increase in bullish sentiment, potentially setting the stage for a push towards the 4300 level.
Regards
Chris
Head Trader
Comments